1. Vulnerability Exposure Driven Intelligence in Smart, Circular Cities
During my final year of my BSc, I wrote my dissertation on vulnerability management dimension in smart city initiatives. As many cities across the globe invest a considerable amount of effort, resources, and budget to modernise their infrastructure by deploying a series of technologies such as 5G, Software Defined Networks, and IoT, we conducted an empirical analysis of their current exposure to existing vulnerabilities. We use an updated vulnerability dataset that is further enriched by quantitative research data from independent studies evaluating the maturity and accomplishments of cities in their journey to become smart. We particularly focus on cities that aspire to implement a (data-driven) Circular Economy agenda that we consider to potentially yield the highest risk from a vulnerabilities exposure perspective. Findings show that although a smarter city is attributed with a higher vulnerability exposure, investments on technology and human capital moderate this exposure in a way that it can be reduced.
Factor Analysis, Cronbach’s Alpha and Barlett’s Sphericity Test
We ran a factor analysis test on the top 20 cities with the highest exposure and potential exploitability to vulnerabilities.
The ended result produced three factors (groups) in total, with a significantly high alpha (over 0.7) in all cases,
showing strong internal consistency and that the respective dimensions (cities in our case) can be reduced and represented
by their assigned factors. See the factors and code below.
| Factor 1 | Factor 2 | Factor 3 | |||||
|---|---|---|---|---|---|---|---|
| Ashburn | 0.7724 | Sydney | 0.7245 | Chicago | 0.9596 | ||
| Tokyo | 0.6910 | Central | 0.8390 | Miami | 0.8154 | ||
| London | 0.9050 | Incheon | 0.8180 | Buffalo | 0.9574 | ||
| Dublin | 0.8811 | Johannesburg | 0.9552 | ||||
| Columbus | 0.8197 | ||||||
| Singapore | 0.8458 | ||||||
| Amsterdam | 0.9710 | ||||||
| Mumbai | 0.8992 | ||||||
| Paris | 0.8611 | ||||||
| Montreal | 0.7529 | ||||||
| Moscow | 0.7682 | ||||||
| Dallas | 0.7713 | ||||||
| Nuremberg | 0.9840 | ||||||
| Cronbach’s Alpha | 0.9614 | 0.9335 | 0.9130 | ||||
| Bartlett’s Sphericity Test: | chi-square: 24144.232 | p-value: 0.000 |
    #create correlation matrix and loadings matrix as dataframe
    res_correlation=pd.DataFrame(fa.corr_,columns=df_pivot.columns, index=df_pivot.columns)
    res_loadings=pd.DataFrame(fa.loadings_,columns=['factor_' + str(i) for i in range(1,fa.n_factors+1)], index=df_pivot.columns)
    res_loadings2=res_loadings.copy()
    cols=res_loadings.columns
    res_loadings['max']=res_loadings[cols].max(axis=1)
    for i in cols:
    res_loadings[i]=np.where(res_loadings[i]==res_loadings['max'],res_loadings['max'],'')
    del(res_loadings['max'])
    res_loadings #resloadings2 for original

    #Cronbach's alpha to check internal structures of groups
    for i in res_loadings.columns:
    itemlist=res_loadings.index[res_loadings[i]!=''].tolist()
    items=df_pivot[itemlist].T
    itemscores=np.ndarray.tolist(items.values)
    print(i,':',itemlist,"\nCronbach's alpha:", CronbachAlpha(itemscores))
Regression Analysis
We performed a regression analysis on our data to determine whether there was any relationship between one or more of our independent variables. We defined the vulnerability exposure \(E_c\) of city \(c\) as:
$$E_c=\sum_{v \in V_c} |v|*b_{v}$$
where \(V_c\) is the multiset of discovered vulnerabilities for \(c\) and \(b_v\) is the CVSS base score of vulnerability \(v\). The above allows the construction of the following hypotheses:
- \(H_2\) The city type moderates the vulnerability exposure such that it is higher for smarter cities than plainer cities.
- \(H_3\) The vulnerability exposure in cities increases with their population.
- \(H_4\) The vulnerability exposure in cities decreases with their level of technology.
Citie’s Risk
It was evident that when a city reached a higher maturity then a vulnerability will carry a larger amount of risk, the higher the maturity level this vulnerability will be placed on. More formally, if \(R_m(\cdot)\) is some risk calculation function with \(m\) denoting the maturity level, then for a particular vulnerability \(v\) the following should hold:
$$R_i(v)\leq R_j(v)$$
This project was submitted, accepted and published to Digital Threats: Research and Practice (DTRAP). Click here to view the article. The code and Jupyter notebooks that was used and submitted can also be viewed on my Github page.
2. APT Groups & Malware Attribution
The purpose of this project was to investigate advanced persistent threat (APT) groups and the methods, tools and tactics that they employ in their attack campaigns. It’s imperative that not only does people from a IT field but everyone else from governments to business owners have a solid comprehension of these tactics and techniques that APT groups use so we could begin to devise countermeasures to make everyone safer online.
Cosine Similarity
We performed a cosine similarity test using our list of APT groups and a list of YARA rules that were associated to them creating a vector for each APT group and the total amount and which YARA rules were associated to them. The closer the value is to 1, the more closely linked two or more groups are. The radius between the APT group Nitro and APT1 was 0 meaning both groups used the same hacking methods. Furthermore, we took our data and researched for any literature connection between the groups in question.
| First APT | Second APT | Similarity | Literature Connection |
|---|---|---|---|
| APT 19 | Shell Crew | 1.0 | Yes |
| APT-C-09 | Dropping Elephant | 1.0 | Yes |
| APT-C-09 | Patchwork | 1.0 | Yes |
| Dropping Elephant | Patchwork | 1.0 | Yes |
| Charming Kitten | Phosphorous | 1.0 | Yes |
| Charming Kitten | TunnelVision | 1.0 | Yes |
| Phosphorous | TunnelVision | 1.0 | Yes |
| Evilcorp | TA505 | 1.0 | Yes |
| MuddyWater | Nobelium | 0.9 | No |
| Mustang Panda | StrongPity | 0.9 | No |
| APT 29 | MuddyWater | 0.9 | No |
| Darkhotel | Pitty Tiger | 0.89 | No |
| APT 1 | Penquin Turla | 0.88 | No |
| APT 10 | Syrian Electronic Army | 0.89 | No |
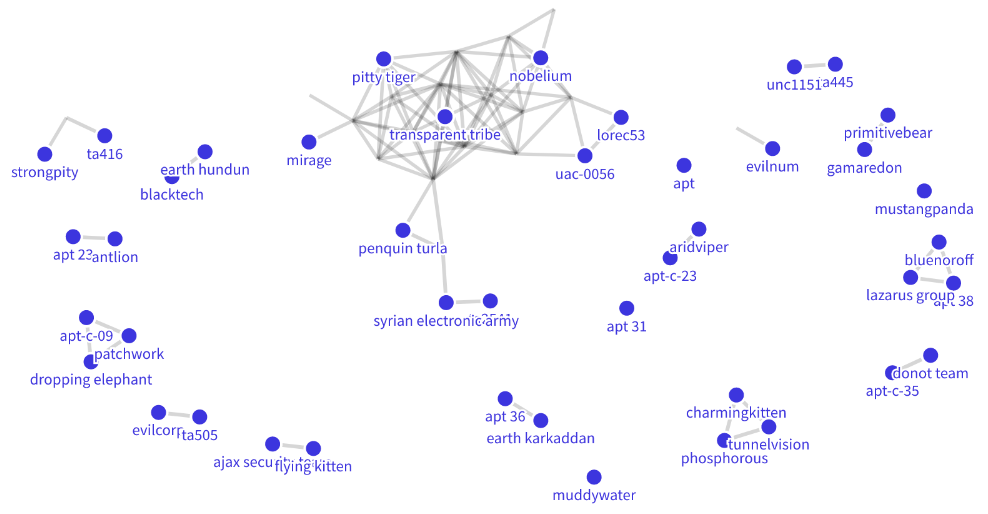
Default Network Diagram
A default network diagram was created to provide a clear, unambiguous picture. APT23 and Antlion is also shown to be linked. A literature connection was found on Twitter where “Arkbird” tweeted:
The datasets that we used along with the Jupyter notebooks can be found on my Github page.